
Small Mistakes, Giant Consequences: 6 Real Stories of Systems That Failed (and Some That Recovered)
A wrong unit in one file. A server that missed an update. A go-live date picked for the busiest season of the year. None of these sounds like a disaster when you write it on a whiteboard. Yet each one, in the real stories below, cost millions, stopped production, or put lives at risk.
What makes these cases worth studying is how ordinary the root causes were. Most could happen in any company that runs on software, spreadsheets, suppliers and handovers between teams.
Here are six well-documented cases, what actually went wrong, and the lesson each one leaves behind.
The Mars probe lost to a unit mix-up (1999)
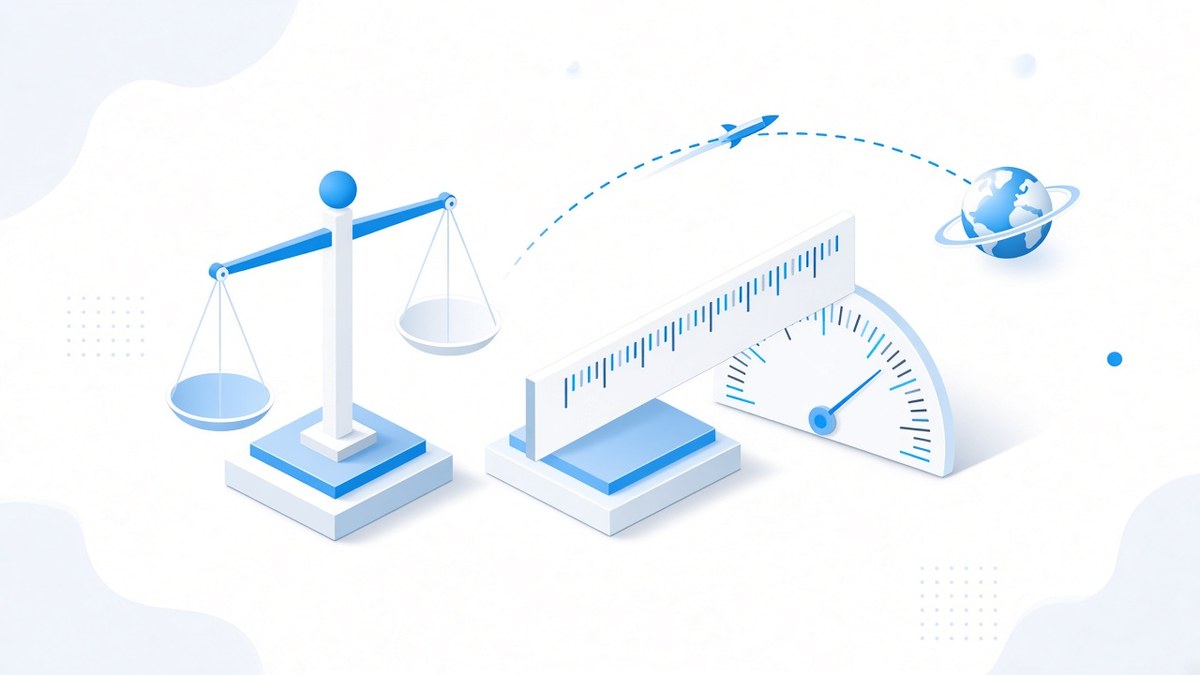
NASA’s Mars Climate Orbiter launched in December 1998 to study the Martian climate and relay data for a sister mission. On 23 September 1999, as it arrived at Mars, contact was lost and never regained. The spacecraft had come in too close to the planet.
NASA’s investigation board found the root cause in a single ground software file called “Small Forces.” It produced thruster performance data in English units (pound-force seconds) when the interface specification required metric units (newton-seconds). One pound of force is about 4.45 newtons, so every small correction fed into the trajectory model was off by that factor.
Takeaway: When two systems exchange data, the meaning of each field (unit, currency, format) is part of the contract. Write it down, and test that both sides actually follow it.
The jet that ran out of fuel mid-flight (1983)
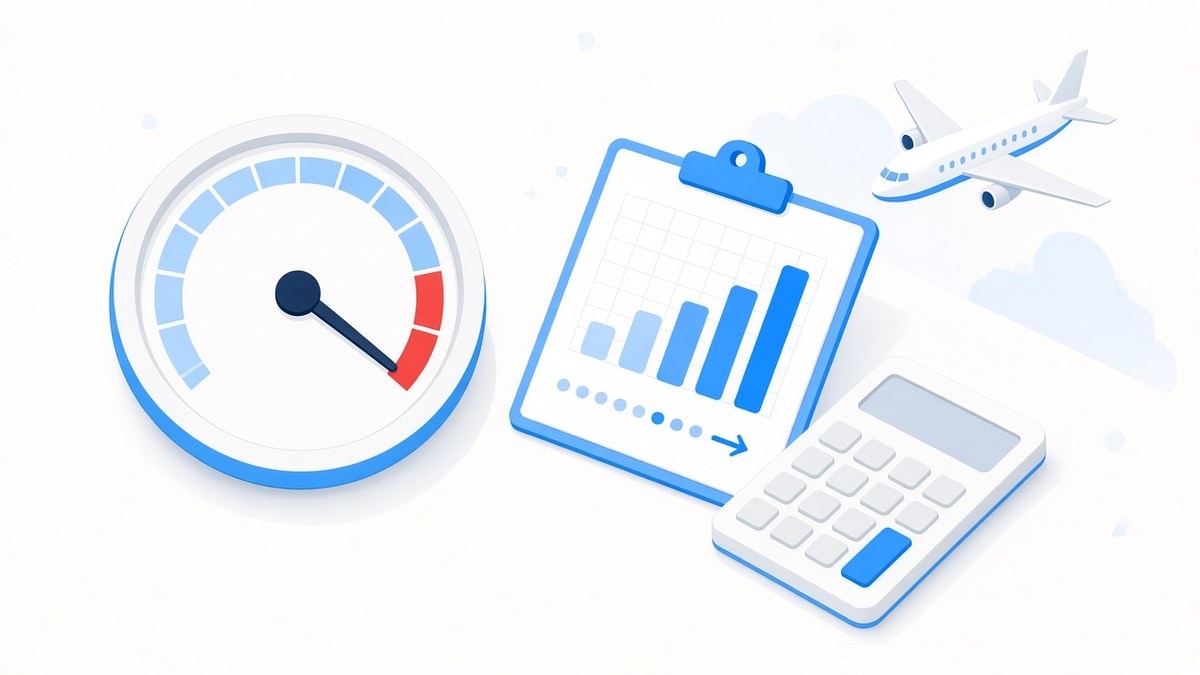
On 23 July 1983, Air Canada Flight 143, a brand-new Boeing 767, ran out of fuel over Ontario on its way from Montreal to Edmonton. It became known as the “Gimli Glider.”
The 767 was one of Air Canada’s first metric aircraft, with fuel measured in kilograms, in a fleet that otherwise worked in pounds. The fuel gauges were not working, so the crew and ground staff calculated the fuel by hand. They used a conversion factor of 1.77, which turns litres into pounds, when converting litres into kilograms needed a factor of about 0.8. The aircraft left with roughly half the fuel the crew believed they had.
Both engines failed. Captain Robert Pearson, who happened to be an experienced glider pilot, glided the aircraft to a disused air base at Gimli, Manitoba. All 61 passengers and 6 cabin crew survived.
The official Board of Inquiry was clear that this was not just one bad sum. In its words, “To suggest that the accident was the result of a metric mix-up is simplistic and inaccurate.” It pointed to deeper problems: no one had been clearly assigned responsibility for manual fuel calculations, staff had no training in doing them, and communication inside the organisation had broken down.
Takeaway: When a process falls back to a manual workaround, make sure someone owns it, it is documented, and people are trained for it. The exception path needs as much design as the normal one.
A 45-minute glitch that cost $460M+ (2012)
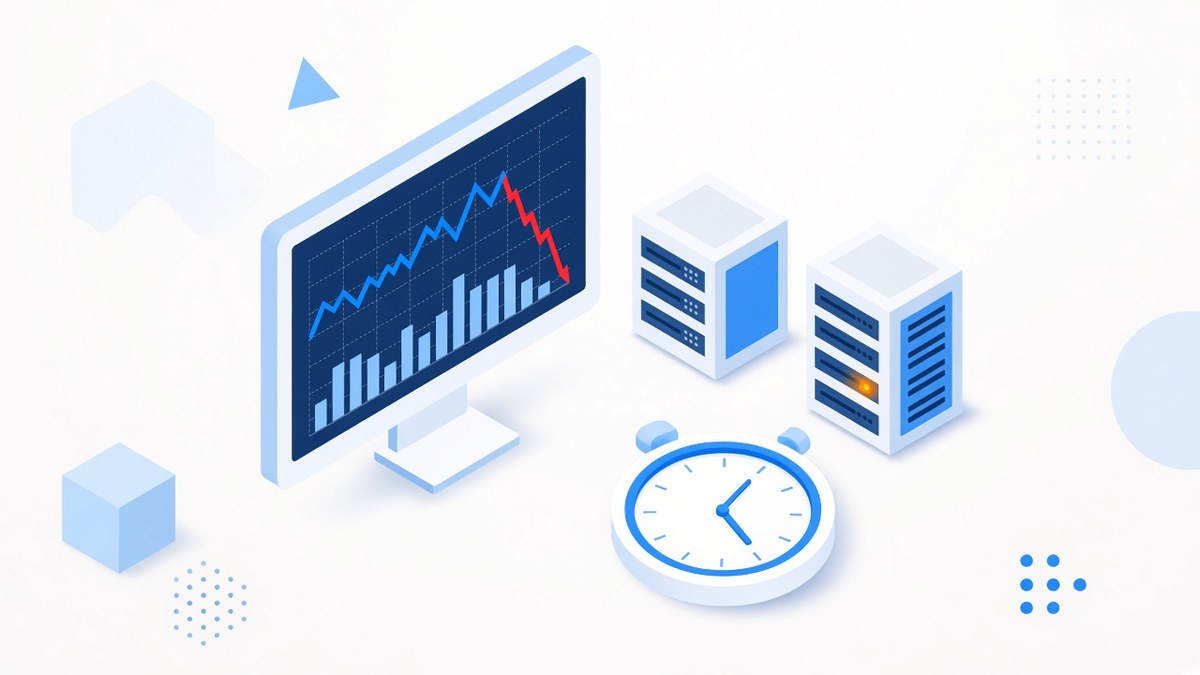
On 1 August 2012, Knight Capital deployed new software for a new New York Stock Exchange program. According to the US Securities and Exchange Commission, a technician did not copy the new code to one of the eight servers involved, and no second person reviewed the deployment.
The new code reused an old flag that had once switched on a retired feature called “Power Peg.” On the one server that had not been updated, incoming orders woke up that old code. In about 45 minutes, Knight’s system sent millions of orders into the market and received more than 4 million executions in 154 stocks, for more than 397 million shares. Knight lost more than $460 million on the unwanted positions.
There were warning signs. Before the market opened, Knight’s systems had sent 97 automated emails flagging an error referencing “Power Peg disabled.” They were not designed as alerts, and staff generally did not review them. The SEC later noted that a written procedure requiring a simple double-check of the deployment could have identified that a server had been missed.
Takeaway: Releases need a checklist and a second pair of eyes. Old, unused code and data should be removed, not left lying around. And alerts only help if they reach someone who is expected to act on them.
The candy maker that missed Halloween (1999)
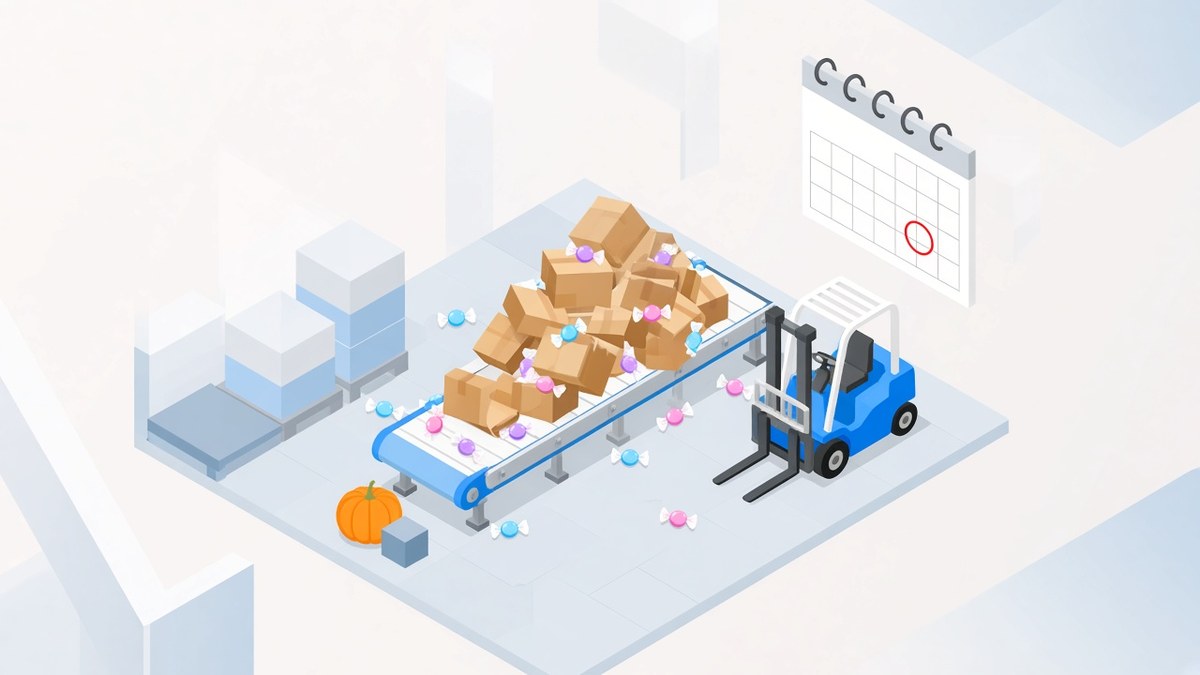
In July 1999, Hershey switched on a new set of business systems for order-taking and distribution, a combination reported at $112 million covering ERP, customer management and supply-chain planning software. The timing put go-live just ahead of its busiest stretch, back-to-school and Halloween.
The company’s own annual report described the result: problems in customer service, warehousing and order fulfilment during peak shipping season led to lost sales, delayed and incomplete shipments, higher freight and warehousing costs, and higher inventories. In September 1999, Hershey’s CEO told analysts the problems would keep the company from delivering $100 million worth of Kisses and Jolly Ranchers for Halloween, and the stock fell more than 8 percent that day. The company later blamed a 19 percent drop in quarterly profit on the problems.
Hershey fixed the issues and stayed with its platform. When it upgraded in 2002, the work underwent extensive testing and was completed in May, months before the Halloween season.
Takeaway: Go-live timing is a business decision, not just an IT milestone. Never cut over right before your peak, and treat testing as protection for revenue, not as optional extra time.
The factory fire Toyota beat in days (1997)
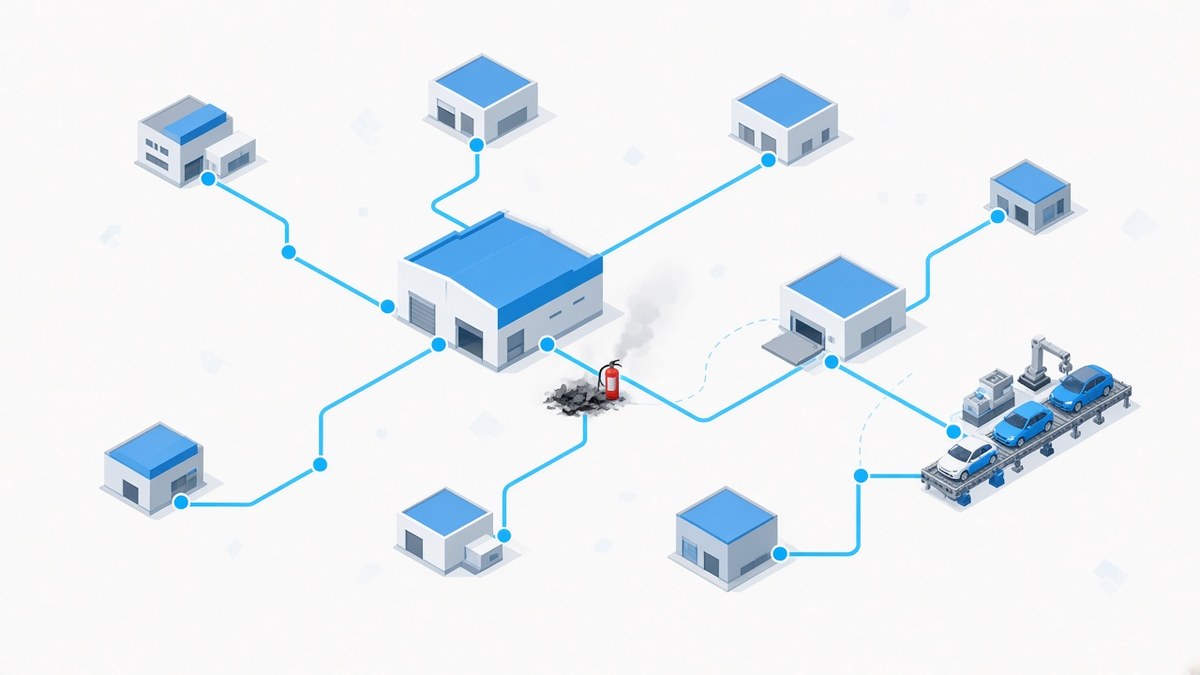
At 4:18 a.m. on 1 February 1997, a fire broke out at a plant of Aisin Seiki, one of Toyota’s most trusted suppliers. It destroyed the lines making proportioning valves (P-valves), a small, cheap but critical brake part used in nearly all Toyota vehicles. Aisin’s plant was essentially the only source, turning out 32,500 a day. Because of just-in-time production, only two or three days’ worth of stock existed.
Within days, most Toyota-group assembly plants had stopped. What happened next is remarkable. More than 200 firms joined the recovery, with about 62 taking direct responsibility for making P-valves, including companies that had never made the part. One was Brother Industries, a sewing-machine maker that had never made car parts. A small supplier delivered the first prototype just two days after the fire. Toyota’s assembly lines restarted within days, and by 10 February, a little over a week after the fire, all Toyota-group assembly plants were back to normal.
The fire still cost Toyota about 70,000 vehicles, but the fast recovery came from years of shared problem-solving habits and trust across the supplier network. Afterwards, Aisin wrote up the lessons in a recovery guide and shared it with 500 firms.
Takeaway: Know which single part, supplier or system could stop your whole operation. Resilience is not only spare stock. It is relationships, shared standards and a recovery plan people have already thought through.
One ship, one canal, a global ripple (2021)

On 23 March 2021, the Ever Given, a 400-metre container ship, was hit by strong winds and ended up wedged across the Suez Canal. Nothing could pass in either direction until it was freed on 29 March.
The BBC, citing Lloyd’s List data, estimated the blockage was holding up about $9.6 billion of goods every day, roughly $400 million an hour, on a route that carries about 12 percent of global trade. By 28 March, at least 369 ships were queuing. Shipping lines weighed rerouting around Africa’s Cape of Good Hope, adding about 3,500 miles and up to 12 days. The stuck ships also tied up empty containers needed for exports elsewhere.
“For each day of delay my thought is it will take two days to undo the delays.”
As one logistics executive told the BBC
Takeaway: A six-day event can disrupt your plans for weeks. Map where your goods and parts actually travel, and build lead-time buffers and alternatives for the routes you depend on most.
What this means for your business
You probably don’t launch spacecraft or trade billions of shares before breakfast. But the patterns behind these stories show up in everyday companies all the time:
- Data definitions drift between systems. A unit of measure, a currency or a date format means one thing in one system and something else in another. Agree on definitions and check them at every handover.
- Manual workarounds have no owner. When the normal process breaks, people improvise. Decide in advance who handles the exception, and give them a simple, documented procedure.
- Changes go live without a second check. A short release checklist and a peer review cost minutes. Skipping them can cost far more.
- Old data and old logic linger. Retired products, inactive accounts and unused settings can wake up at the worst moment. Clean them out on a schedule.
- Warnings go to nobody. Make sure alerts are few, meaningful and routed to someone who is expected to act.
- Go-live dates ignore the business calendar. Plan system changes around your quiet season, not your peak.
- Single points of failure stay invisible. List the one supplier, one person, one route or one system you could not run without, and plan for losing it.
None of these fixes needs a big budget, just ownership and the habit of asking, “What happens if this small thing is wrong?”
The bottom line
Big failures rarely start big. They start with a unit nobody checked, a step nobody owned or a warning nobody read. The small disciplines that prevent them are within reach of any business.
At SOD Infotech, we help businesses run on clearer, better-connected systems, so the small mistakes get caught before they grow.
Sources
- Mars Climate Orbiter — NASA Science mission page
- NASA Mars Climate Orbiter Mishap Investigation Board, Phase I Report (root cause, lbf-s vs N-s, 4.45 factor)
- Gimli Glider — Final Report of the Board of Inquiry, Air Canada Boeing 767 C-GAUN (Lockwood, 1985), hosted by FAA
- Knight Capital — SEC Order, Release No. 34-70694 (16 Oct 2013)
- Hershey — CIO, "Supply Chain: Hershey's Bittersweet Lesson" (2002)
- InformationWeek, "Hershey's Biggest Treat: No Tricks" (29 Oct 2002)
- Hershey Foods 1999 annual report filing (SEC EDGAR)
- Toyota / Aisin fire — MIT Sloan Management Review, Nishiguchi & Beaudet, "The Toyota Group and the Aisin Fire" (1998)
- The Japan Times, "Toyota plants back in operation" (7 Feb 1997)
- Ever Given / Suez — BBC News, "Suez blockage is holding up $9.6bn of goods a day" (26 Mar 2021)
- Wikipedia, "2021 Suez Canal obstruction" (dates, 369 ships queuing by 28 March)