
When the Numbers Lie: 5 Real Stories of Stock, Data and Demand
A screen says a product is in stock. A forecast says to order more. A planner trusts both, because that is what the numbers are for. But what happens when the numbers are wrong, or are telling a different story from the one you think you are reading?
This week we look at five well-documented cases where stock, data and demand drifted apart. Some companies lost hundreds of millions. One shut most of its restaurants for days. And one used its numbers so well that it knew which breakfast snack to send ahead of a hurricane.
None of these stories is really about software. They are about the gap between what a system records and what is actually happening on shelves, in warehouses and in customers’ homes.
Pampers and the bullwhip effect
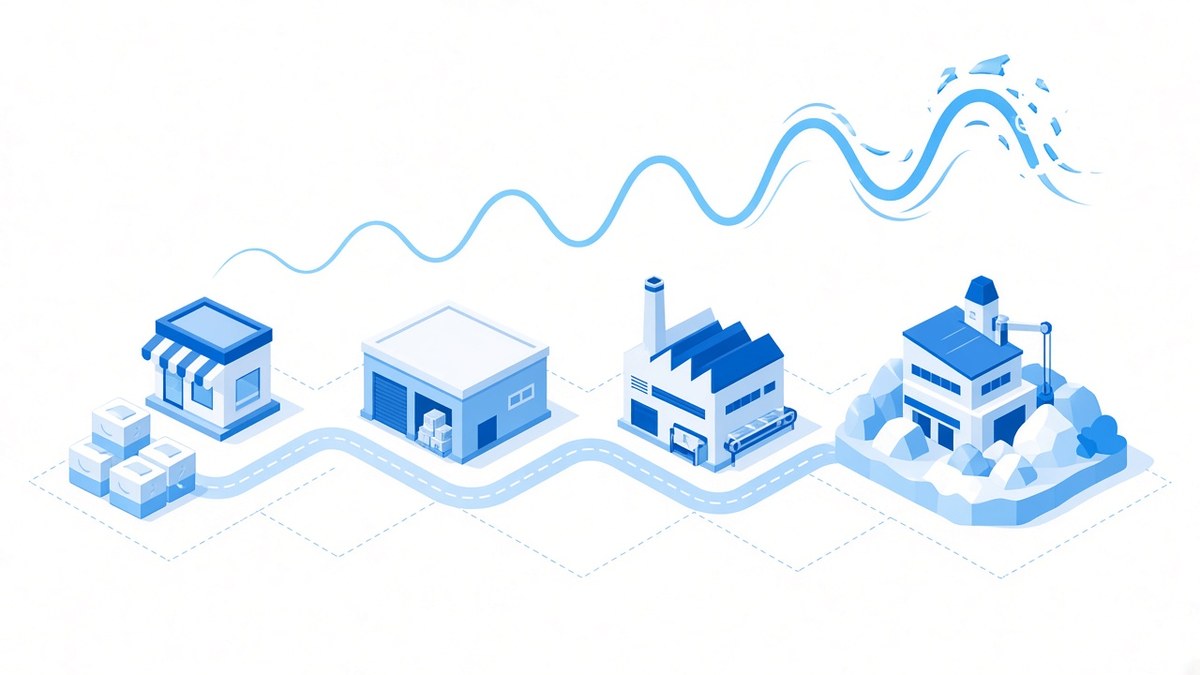
In the 1990s, logistics executives at Procter & Gamble looked closely at the order patterns for Pampers, one of their best-selling products. Babies use nappies at a fairly steady rate, and sales in shops moved up and down only a little. Yet the orders that distributors placed with P&G swung much more widely, and P&G’s own orders to its material suppliers, such as 3M, swung more widely still.
P&G called this the “bullwhip” effect, and Stanford researchers Hau Lee, V. Padmanabhan and Seungjin Whang described it in a 1997 MIT Sloan Management Review article. They found the same pattern at Hewlett-Packard, where a reseller’s printer orders swung far more than its actual printer sales.
Why small swings grow
Each link in the chain sees only the orders from the link below it, not real customer demand. Add some safety stock, a bulk order to get a discount or a promotion, and a gentle ripple at the till becomes a big wave at the factory.
Distorted information from one end of a supply chain to the other can lead to tremendous inefficiencies: excessive inventory investment, poor customer service, lost revenues, misguided capacity plans, ineffective transportation, and missed production schedules.
Lee, Padmanabhan and Whang, MIT Sloan Management Review (1997)
Takeaway: Plan from real demand, not just from the orders in front of you. The more your partners share actual sales and stock data, the less each link has to guess.
Nike and the forecast that ordered the wrong shoes

In June 2000, Nike switched on a new i2 demand-planning system for its footwear. According to court documents and a detailed 2004 CIO account, it went badly. The system ignored some orders and duplicated others. It also deleted ordering data six to eight weeks after it was entered, so planners could not see what they had already asked factories to make.
The result was too many orders for slow sellers such as the Air Garnett and too few for popular shoes. In February 2001, Nike said shoe sales for the quarter would be $80 million to $100 million lower than expected, and its share price fell 19% in a day, the Los Angeles Times reported. Chairman Phil Knight famously asked analysts: “This is what you get for $400 million, huh?”
What Nike changed
Nike later moved short- and medium-range sneaker planning into its main ERP system and took training far more seriously. CIO reported that its US customer service staff received 140 to 180 hours of training and were locked out of the new system until they finished it.
Could the planners have been better prepared to use the system before it went live? You can never train enough.
Gordon Steele, Nike CIO, speaking to CIO magazine (2004)
Takeaway: A forecast is only as good as the data and the people behind it. Test new planning tools against real orders before they drive purchasing, and train users before go-live, not after.
Target Canada: full warehouses, empty shelves
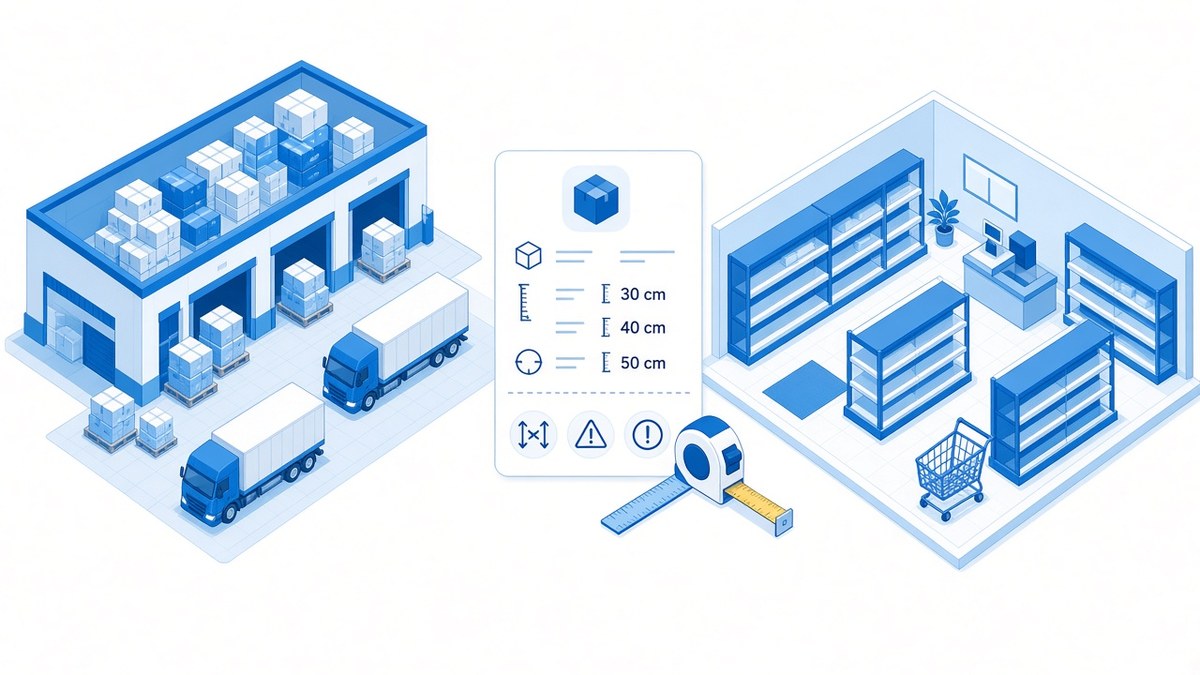
When Target opened in Canada in 2013, shoppers found empty shelves while the company’s distribution centres were overflowing. Canadian Business, which interviewed close to 30 former employees, traced much of the trouble back to product data.
Staff had to enter details for roughly 75,000 products into a brand-new SAP system on a tight schedule. Dimensions were entered in inches instead of centimetres or in the wrong order, currencies were wrong and fields were missing. An internal team estimated the data was accurate about 30% of the time, compared with 98% to 99% in Target’s US business. The company held a “data week” to check every product by hand.
When the system says “in stock”
Because replenishment depended on exact product and shelf dimensions, bad data meant stores could not be refilled reliably. Some analysts, judged on in-stock percentages, even switched off automatic replenishment for items so they would not show as out of stock. Target Canada closed all 133 stores by April 2015, after losses of about $2.1 billion.
Takeaway: Master data is not admin work. Validate item data at the point of entry, and never reward people for numbers that look good on screen instead of on the shelf.
KFC and the great chicken shortage of 2018
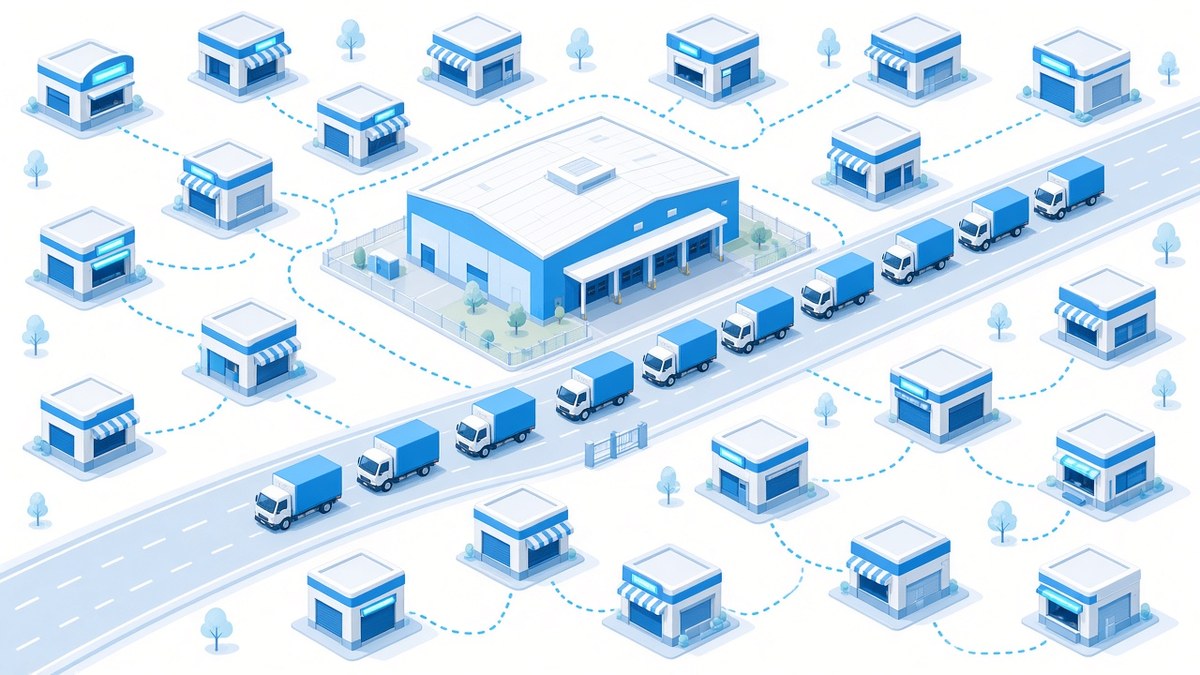
In February 2018, KFC moved its UK chicken deliveries from Bidvest to DHL. Within days, restaurants began running out. BBC News reported that more than half of KFC’s 900 UK outlets had closed, and WIRED reported that by 18 February only 266 of 870 restaurants in the UK and Ireland were open.
WIRED noted that DHL was serving the network from a single warehouse in Rugby, compared with Bidvest’s six, and that a serious crash on the nearby M6 slowed lorries on the very first day of the new contract. KFC handled the moment with humour on social media, but the shortage made national news.
The fact that it was a new warehouse, new IT system, and the handover was just happening, makes this a perfect storm.
Samir Dani, professor of logistics and supply chain management, speaking to WIRED (2018)
Takeaway: Never change everything at once. Run old and new partners or systems side by side where you can, and have a fallback ready for the first weeks of any handover.
Walmart, hurricanes and strawberry Pop-Tarts

Not every story ends badly. In 2004, as Hurricane Frances headed for Florida, Walmart’s chief information officer Linda Dillman asked her team to forecast demand using sales data from Hurricane Charley, which had struck a few weeks earlier, The New York Times reported.
The analysis showed more than torches and water. Sales of strawberry Pop-Tarts rose to about seven times their normal rate before a hurricane, and the top-selling pre-hurricane item was beer. Walmart sent trucks loaded with both down Interstate 95 to stores in the storm’s path, and most of the extra stock sold quickly.
We didn’t know in the past that strawberry Pop-Tarts increase in sales, like seven times their normal sales rate, ahead of a hurricane.
Linda Dillman, Walmart CIO, to The New York Times (2004)
Takeaway: Your past sales already contain your next forecast. Clean, connected history lets you prepare for an event before it arrives, instead of reacting once the shelves are empty.
What this means for your business
Look closely and these five stories share one theme: decisions were only as good as the data underneath them. Pampers and Walmart show the same lesson from opposite sides. When you see real demand, you can plan calmly. When you see only distorted signals, you overreact.
You do not need to be a global brand to face these risks. Any company that buys, stocks and sells can check a few basics:
- Your item data is checked when it is entered. Units, dimensions, pack sizes and prices should be validated, not trusted.
- Stock on screen matches stock on the shelf. Regular cycle counts catch gaps before customers do.
- Purchasing follows real sales, not just incoming orders. Share demand data with key suppliers where you can.
- New systems are tested with real data and trained users. Go-live is a business decision, not a date on a project plan.
- Handovers have a fallback. Changing a logistics partner, warehouse or system needs a plan B for the first weeks.
- Targets reward reality. Measure what customers experience, so no one is tempted to make a dashboard look green.
At SOD Infotech, we help businesses connect stock, purchasing and sales in one reliable system, so the numbers you act on reflect what is really happening.
Sources
- Pampers / bullwhip — Lee, Padmanabhan & Whang, "The Bullwhip Effect in Supply Chains," MIT Sloan Management Review (15 Apr 1997)
- Nike — CIO, Christopher Koch, "Nike rebounds: How (and why) Nike recovered from its supply chain disaster" (15 Jun 2004)
- Nike — Los Angeles Times / Bloomberg, "I2 Shares Plunge After Complaint on Product" (28 Feb 2001)
- Nike — In re Nike, Inc. Securities Litigation, 181 F. Supp. 2d 1160 (D. Or. 2002), Justia
- Target Canada — Canadian Business, Joe Castaldo, "The Last Days of Target" (1 Jan 2016)
- Target Canada — Wikipedia (133 stores, closure date, $2.1 billion losses)
- KFC — BBC News, "Chicken chaos as KFC closes outlets" (19 Feb 2018)
- KFC — WIRED, Richard Priday, "The inside story of the great KFC chicken shortage of 2018" (21 Feb 2018)
- Walmart — The New York Times, Constance L. Hays, "What Wal-Mart Knows About Customers’ Habits" (14 Nov 2004)
- Walmart — same NYT article, Internet Archive copy (no paywall)